Home FAQ CSV Guide Percentiles

Frequently Asked Questions

Frequently Asked Questions

If you need help figuring out how to use the app, check out our video user guide. If you still have questions, don't hesitate to email with any questions, concerns, or feature requests you have!

Your data is either stored in the cloud or on your phone (local storage). Use the cloud icon on the toolbar to check where your data is being stored, sign in or out, and make CSV backups so your data is secure!

Local storage

Local storage
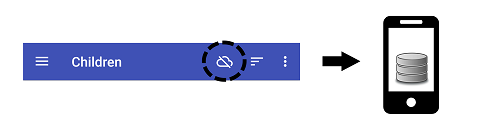
  • Data is stored on your phone
  • It is up to you to make backups
  • We cannot recover any lost data
  • It is up to you to migrate your data over if you get a new phone
Local storage
  • There is a helpful backup reminder!
  • Click the cloud icon or top right menu to make a CSV backup file at any time

Cloud storage

Cloud storage
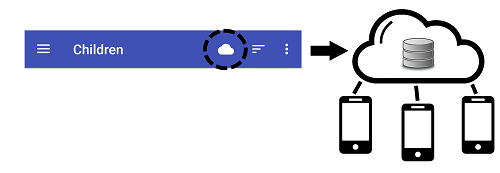
  • Logging in is completely optional
  • Data is stored in the cloud
  • Easy to migrate to a new phone (just log in)
  • Data is synced between devices

Always backup your data!

If you have created an account and logged in (from within the app) your data will be backed up automatically to the cloud (this is usually the best option).

If you don't log in, the app provides a convenient CSV import/export feature to let you back your data up to a location of your choosing (e.g. Google Drive). It is always a good idea to make a periodic CSV backup even if you use the automatic cloud backup. This is a very good idea to do before discarding your old phone!

You can also use a system-level backup tool like Android backup. If you have Android backup enabled, your app data will be backed up to Google Drive. You can go there and look at the Backup menu to see which devices are being backed up. To get this data on your new phone, you need to either do a data migration from the old to new phone (connect the two phones with a cable during setup) or specifically select the cloud backup to restore the phone from. Simply logging in to the new phone with the same Google account will not automatically migrate your app data!

We get this question all the time! The WHO only publishes weight data up to 10 years old - above that age they recommend using BMI as a better indicator of healthy weight since it accounts for height variations too. You can read about it on their web page too (quoted below).

Weight-for-age reference data are not available beyond age 10 because this indicator does not distinguish between height and body mass in an age period where many children are experiencing the pubertal growth spurt and may appear as having excess weight (by weight-for-age) when in fact they are just tall.

What if you want to plot weight beyond 10 years old? Well fortunately many of the other growth curves in the app do include weight data above 10 years old. One common choice is to use the CDC or WHO-CDC curves. You can see a complete list of the available curves and their age ranges on the percentiles page.

To change which curve you're plotting, just click the pencil icon in the top right corner of the chart page and select a different growth curve from the drop-down menu. If you don't see the curve you want, it might not be activated. Go to the app Settings to activate it.

Unfortunately, license management for the Pro version of the app is handled through Google Play and sometimes needs to be re-synced manually. To do this, you need to clear the App Data and Cache Data for both the Google Play and Google Play Services apps. There are instructions from Google for how to do this here. This can also sometimes help with other non-license issues like inability to connect to the cloud too.

But my phone doesn't have Google Play Services! - Yes, it does. The Google Play Store and core functionality of many apps (including this one) would not work without it. However, some phone manufacturers hide it in the app list. You may need to look around for a 'Show all Apps' or 'Show advanced' option.

If you have tried the steps above and are still having problems, feel free to email us for help or use the in-app feedback tool.

If you make a common unit error, like mixing up grams and kilograms, meters and centimeters, or feet and inches the app will suggest an automatic conversion. If you don't appear to have made a common unit error, the app will show a warning and will not allow a measurement if it is outside the bounds in the table below.

The only time the app will completely reject a measurement is when it is outside the table bounds - in other words, a baby that is half the size of a hamster or as large as a compact car.

Entry Min Max
Weight0.05 kg (1.8 oz)600 kg (1323 lbs)
Height5 cm300 cm (9.8 feet)
Head5 cm120 cm (47 in)

For context, the world record for the heaviest human is 558 kg, the record for the tallest human is 272 cm, the smallest preemie baby was 0.242 kg (0.53 lbs), and the largest recorded adult head circumference was around 95 cm.

If your measurement is within these bounds, but is more than 15 standard deviations above or below the average you will get a warning but will be able to keep the measurement as-entered if you want. You can disable these checks in the app settings if you find it necessary.

There are two things that cause jumps in the curves: a switch from length (lying down) to height (standing up) and a switch in the data set itself.

Change in Height

There is a small but measurable difference between a child's length (laying down) and height (standing up). On most curves this difference is about 0.7 cm. Both the WHO and CDC curves switch from length to height at age 2, so you will see a jump in all height-based curves at that point (height, weight vs height, and BMI).

Height jump

Change in the Data Set

Several of the curves are generated using a combination of charts from different age ranges. For example, the WHO curves use the WHO 0-5 years curves and the WHO 5-19 years curves. These curves are not exactly the same, so there will be a small jump at age 5 in the WHO curves.

The app also has several combination charts (e.g. WHO-CDC or WHO-IAP) which follow recommendations from various pediatric societies on when to switch from the WHO curve to the country-specific curve. For example, the WHO-CDC curve uses the WHO curves up to age 2, and the CDC curves above that. Since the curves are different, there will be a jump at age 2. The WHO-IAP combination chart on the other hand has this transition at age 5. The combination charts will show a light colored vertical line on the chart at the transition point between charts.

Data set jump

Short answer: it's not. Every single growth curve in the app is digitally verified against its official source before every app release.

The app has a substantial, satisfied user base including parents, doctors, lactation consultants, and midwives but we still get questions every now and then from people convinced they've found a fatal error where the app is calculating the percentiles wrong. We listen to every concerned user, and so far not a single one has actually found an error in the percentile calculation. If you find yourself with the same concern, take a moment to check the list of common points of confusion below.

  • Comparing to the wrong chart. This usually happens when someone has a printed chart or gets a percentile from their doctor and compares it with a percentile on a different growth chart in the app. For example, the UK has a variant of the WHO curves (UK-WHO curves - available in the Premium version of the app). Above the age of 4 they are different from the regular WHO curves, but it's easy to get them confused and compare the UK-WHO percentile you got from the doctor or a booklet with the international WHO curve in the app. If you have a PDF or paper chart check the reference printed on it or the source for it - then compare that with the references on our percentiles page to make sure you're actually comparing the same charts.
  • Making an error in your entries. Double check the child's birthday, due date (if entered), and gender. Then double check that the measurement values are correct and that the measurement date you selected is the date the measurement was actually taken on. Not sure how to do that? Take a look here.
  • Improperly drawn hand-chart. If you're comparing to a paper chart filled in by hand, make sure the points on the chart were actually drawn in the right place.
  • Comparing different percentile lines. The choice of which percentile or Z-score lines to draw on the growth chart is somewhat arbitrary and has no bearing on the accuracy of the calculated percentiles at any given point. The outer percentile lines in the app are 3% and 97%, and the outer Z-score lines are -2.5 and 2.5. Other printed charts may use different outer lines (e.g. 0.4% and 99.6%, or Z-scores of -3 and 3). If you are just comparing where a point falls relative to the outer lines, it may not be directly comparable. Click the point on the chart to see the exact percentile at that point and use that to compare.
  • Not understanding units of time. All the growth data and percentile calculations in the app use age in days, which is unambiguous. However, the app or growth tables you may find will show colloquial age units like "2 months old" in some places. Remember that while a week is exactly 7 days, a month is not exactly 4 weeks, and 2 months is not exactly 8 weeks. The WHO-defined standard month for growth purposes is 30.4375 days (based on 365.25 days per year, accounting for leap years) - so if a table lists a percentile at "2 months" it is really at 60.875 days. All ages within in the app are calculated in single day increments and interpolated appropriately.

Of course, if you still have questions feel free to send us a message with the in-app feedback tool and we'll be happy to help. Be sure to include enough details about what you're seeing and what you expect to see so we can help.

Now that you've put your child's measurements in, you might be wondering "what do these percentile or Z-score numbers mean?" A percentile just tells you how your child's measurement compares to other children of the same age and gender. For example, a weight measurement that is 30th percentile means that on average your child is heavier than 30% of comparable children and lighter than 70% of them.

So then what is a Z-score? A Z-score and a percentile both tell you how your child compares to the average. The Z-score is the number of standard deviations above or below average. The app can show either a Z-score or a percentile. You can choose whether to see percentiles or Z-scores when setting up the chart (click the pencil icon in the top right corner of the chart screen). The table below shows a few different Z-scores and the percentiles they correspond to.

Z-Score Percentile
-2.50.6%
-22.3%
-115.9%
050%
+184.1%
+297.7%
+2.599.4%

So what does it mean? You usually shouldn't worry about the specific number, a child in the 10th percentile or 90th percentile can be perfectly healthy. What your pediatrician will typically use these numbers for is making sure your child is growing at a healthy rate. A child who drops from 90% to 10% will cause more concern to your pediatrician than a child who has been around 10% since birth.

Want to read more? Check out the what is a percentile page!

Child Growth Tracker has WHO percentiles from birth to 19 years of age in most cases, CDC percentiles from birth to 20 years of age, the Fenton pre-term percentiles for 24 to 48 gestational weeks, Down Syndrome curves, and dozens of country-specific curves. Visit the percentiles page for a complete list and more details.

Child Growth Tracker has both CDC and WHO growth curves (and many others!). The general recommendation in the US is to use the WHO curves from birth to age 2, and the CDC curves from age 2 onward. What's the difference? Well the CDC curves are a growth reference based on measurements of both formula-fed and breastfed US children, while the WHO curves are an international growth standard for breastfed babies (CDC reference here).

There are a couple other growth references included based on different populations. For example, the IAP references are based on Indian children, the UK90 references are based on children in the UK, and the Chinese references are based on children from different regions in China. Check the percentiles page for details on all the available curves.

The app also includes the Fenton pre-term growth curves. If your child is born early, the WHO and CDC curves will likely give a very low percentile. However, babies grow rapidly so it is more accurate in that situation to use gestational age rather than time since birth. The Fenton curves are designed to approximately match the WHO curves at around 48 weeks gestational age. The Preterm-WHO combination chart transitions from the Fenton curves to the WHO curves at this point. You can also enable corrected age (age based on due date) on any of the regular charts to account for preterm birth.

When you are setting up the chart, or if you click the edit chart button (pencil icon in the upper right corner of the chart screen), you can select additional children to add to the chart from the 'Additional Children' dropdown menu.

Additional children

The Preterm (Fenton) curves only go up to 48 weeks gestational age, however you can use the "Corrected age" feature for premature babies with all the other curves. When this option is checked, the child's percentiles will be displayed using age based on his or her due date rather than birthday. By the time the child is around 2 years old, the use of a corrected age is not usually needed any more.

To use this feature, select the "Use Corrected Age" option on the Edit Chart page. The child must have a due date entered for this box to be enabled.

Each chart has a specific age (or height) range it is valid for. For example, the CDC BMI data is available for age 2 to 20 years, while the CDC weight vs. height charts only go up to 120 cm. These limits are based on the original data sets, not just imposed by Child Growth Tracker. If your measurements are outside that range, they won't show up. Check the percentiles page to see the age ranges for all the charts.

Some measurements also require multiple entries. For example, BMI requires both height and weight. if you only have entered one of these in a given measurement, that measurement won't show up on the chart or table. If you would like the app to interpolate weight or height to fill in more points on the BMI or Weight vs. Height curves, you can enable interpolation in the app settings.

It is also possible you made a unit error in your entry. Double check that the value and unit match what you intended for each measurement (e.g. that you did not enter grams instead of kilograms or mix up cm and inches).

The age for each measurement is calculated based on the date you entered for that measurement and the child's birthday (or due date if using gestational age or corrected age). If the age looks wrong, double check that you entered the right date for the measurement and for the child. The date you put for each measurement should be the date that measurement was taken on. If you're not sure how to do this, take a look at the examples here.

You can import and export data from Child Growth Tracker using CSV files (comma-separated-values). Click the three-dot menu in the top right corner of the main screen to import or export data for all children, or long click on a child's card to export just a single child's data to a CSV file.

CSV files are an open-source spreadsheet format you can view and edit with Excel, Open Office, Google Drive, or even manually in Notepad. See the CSV Guide for more details.

If the CSV import doesn't recognize what you've entered for a given measurement, it will ignore the parts it can't understand. For example, if you enter "3.2 kg" as a height, it will leave the height field blank. If you enter the date for a measurement in an un-recognized date format the entire measurement will be skipped. For some formatting rules and examples of correctly formatted CSV files, see the CSV Guide.

You may also be at or near the limit for the number of children or measurements in the app. If importing a CSV file would put you over the limit, the full file may not be imported.